Thursday, May 15, 2014

Keeping Banana-plug and Alligator-clip Cables Untangled and Accessible

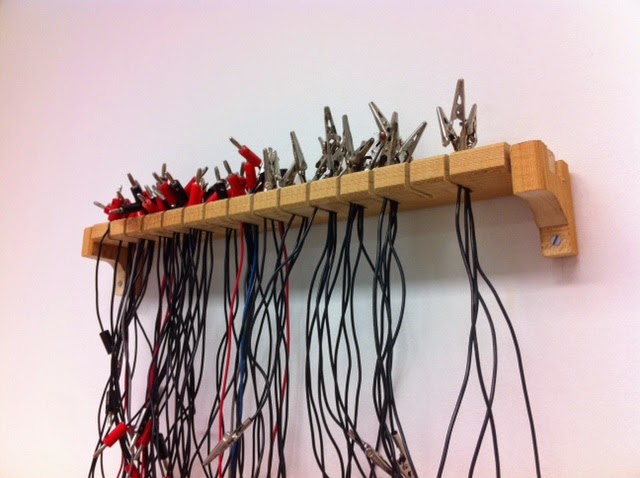
Alligator-clip cables have this tendency to act like little grappling hooks and latch on to other cables forming impenetrable knots. I saw a simple solution to this problem back when I was in university studying Electrical Engineering. We had labs fitted with all kinds of gear and hanging on the wall was a rack of neatly organized cables. I made it my side-project this week to replicate that rack at school:


I guess it doesn't look that orderly but believe me, it's an improvement. It took me half an hour to untangle the cables that I loaded onto the rack in this picture.

The rack is detachable from the wall so you can carry the cables to other classrooms when necessary. Gravity keeps it seated in two brackets screwed into the wall.


I'm not a carpenter but I swear I can do better woodwork than this; I was low on free-time and itching to get the job done. I don't think I measured a single cut!

Thursday, March 20, 2014

Setup OneSchool Reporting Helper

To learn how to use OneSchool Reporting Helper, go to this previous post. This is a guide to first-time setup.

In my previous post, I introduced OneSchool Reporting Helper; a tool to help streamline reporting in OneSchool. If you don't use OneSchool for Reporting it may be possible to make minor adjustments to the source code to suit your reporting infrastructure. However, even if you do use OneSchool, the Reporting helper still needs some configuration the first time it's run. This configuration only needs to be done once. It's not hard, but if you've never heard of HTML you'll probably want a hand from your school's IT pro. With the initial set-up complete you can then distribute the settings to the rest of the teachers in your school.

In total, to set-up the program we need to do two things:

  1. Locate the HTML ID of all the controls in OneSchool we want to interact with
  2. Create a matrix of reporting options to fill in those controls.
Here's the whole process step by step:

1) When you first run the Reporting Helper, it will warn you that it doesn't have a settings file. This is normal; we haven't built one yet.

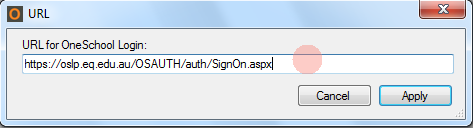
2a) The Reporting Helper will open up OneSchool in its own browser but we first need to point it to that URL. Click Setup > OneSchool URL

2b) Copy the URL for the OneSchool Login into the dialog box and click apply.
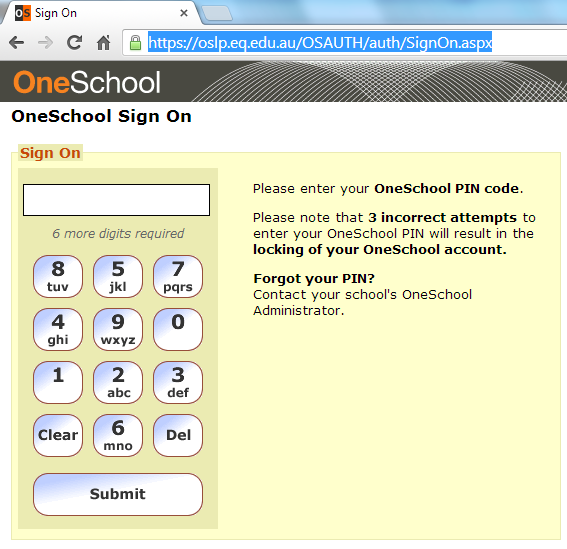
Copy this URL...
...into this dialog box.
3a) Next we need to start locating the HTML IDs of the controls we're going to interact with. At the moment we don't have any buttons to do our reporting with. We also need to set up the Save and Save and Next buttons because they also interact with HTML controls. That's what we'll do first
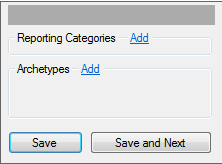
No reporting buttons are set up yet.
3b) Open up OneSchool in your favorite browser (Chrome, Firefox, IE, but NOT in the Reporting Helper) and navigate to your reporting page. This is where you would normally enter data for your students. Right-click somewhere empty on the form and click "view page source". 
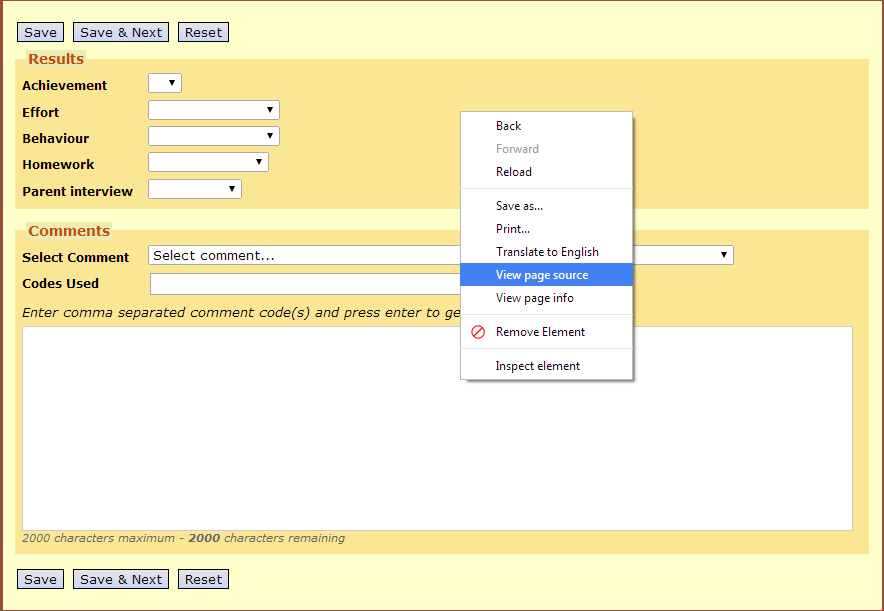
This image was captured in Chrome. If you have a different browser you might need to look up how to view a web page's source code with that browser
3c) First, let's find the HTML ID for the "Save" button and copy it. It looks like this:

Copy the HTML ID for the "Save" button
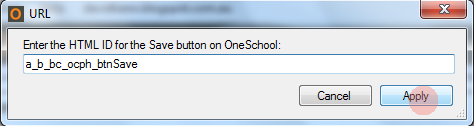
 3d) Then we need to right-click on the save button in the Reporting Helper, and paste the HTML ID into the dialog box and click apply

Right Click on "Save" then...
...paste the HTML ID into the dialog box.


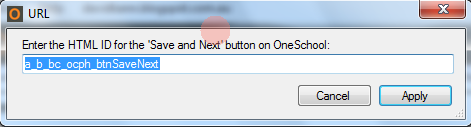
3e) We'll do the same thing for the Save and Next button. Find the HTML ID, right-click on "Save and Next", then paste into the dialog box and click apply.

Copy the HTML ID for the "Save and Next" Control

Right Click on the "Save and Next" button and this dialog will appear. Paste in the HTML ID and click Apply
4a) Now it's time to set up the HTML ID for the comment box. In the HTML Source, locate the HTML ID for the comment box, and copy it.


4b) In the Reporting Helper, click Setup > Comment Box HTML ID and a dialog box will appear. Paste the Comment Box's HTML ID into the dialog box and click apply


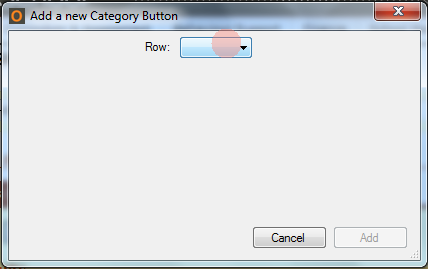
5a) Now it's time to start adding reporting buttons. In the Reporting Categories toolbox, click the text that says "Add". A window will appear. Select Row 1 from the window.
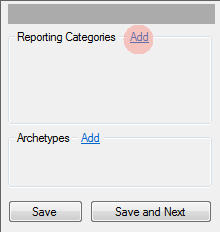
Click "Add" next to "Reporting Categories"

In the drop-down menu for row, select row 1.
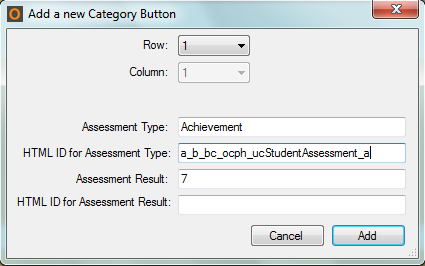
5b) This will cause a number of new options to appear in the window. Here is where we will set-up the reporting options. Since this is the first row of reporting options we'll map it to the first reporting criteria, "Achievement". You first reporting criteria may be different so you might type something else under "Assessment Type". My top result for Achievement is a "7", so this button's "Assessment Result" will be 7.
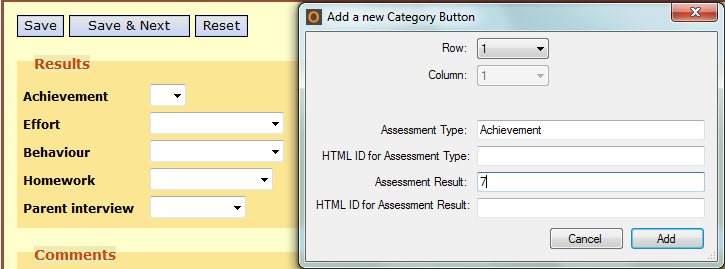
Your Reporting is probably different to mine so you will enter whatever it is that you report on. I report on "Achievement", and it's a scale from 7 to 1.
5c) We want this button to report 7 for Achievement but to do that we need the HTML ID of the Achievement drop-down menu. Going back to the source code, we'll copy the HTML ID for the Achievement drop-down menu and paste it into the "HTML ID for Assessment Type" box.
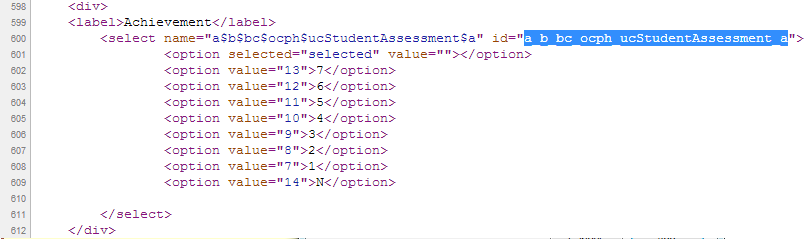
Copy the HTML ID...

...and Paste.
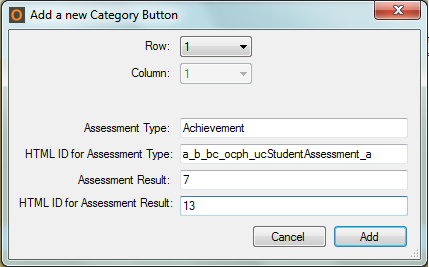
5d) The last field is the HTML Value for a 7. Looking at the same section in the source code, we get the HTML Value for a 7. Copy this and paste it into "HTML ID for Assessment Result":
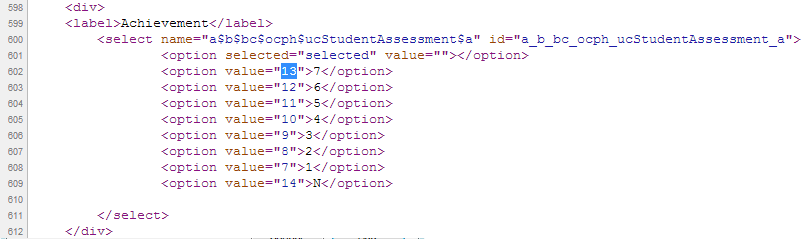
Copy the HTML Value...

...and paste
5e) Click "Add" and the button we configured will be added to the Reporting Categories Toolbox:
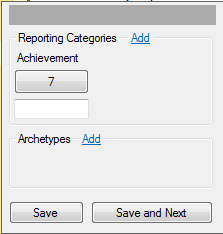
This new button will insert "7" into the "Achievement" report.
6) Follow the same process in steps 5a-5e to create buttons for all the reporting results in this reporting type:
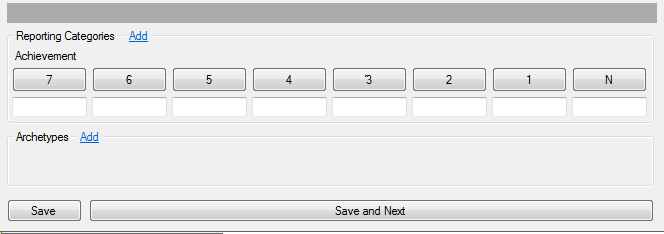
In my case, Achievement is graded on a 7 to 1 scale, with and additional N for "No Record". Your Reporting may look different.
7) Next we need to go through the same process in steps 5a-6 to add another row of buttons for our next Assessment type. In my case, that's "Effort". I found the HTML ID for effort, and filled in buttons for all the Effort Results:
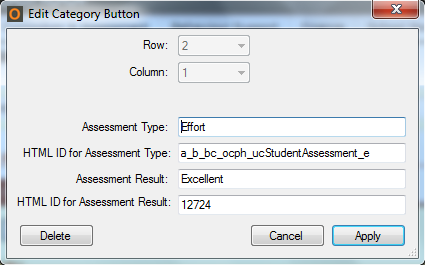

This Assessment Type is next on the list after Achievement so it's in Row 2.
8) Continuing this pattern, we can fill in buttons for all the Assessment Types and Results:
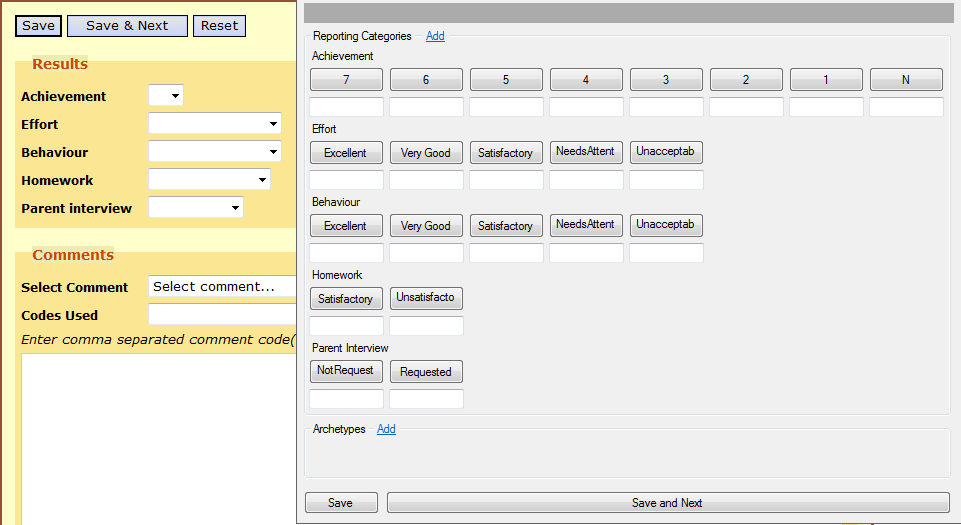
Every Option for Achievement, Effort, Behaviour, Homework, and Parent Interview have buttons associated with them now.
9a) The final step is to create some Archetype Buttons. The user will configure the Archetype buttons to their needs but it's a good idea to get a few default ones set up. Click on the text "Add" next to "Archetypes:


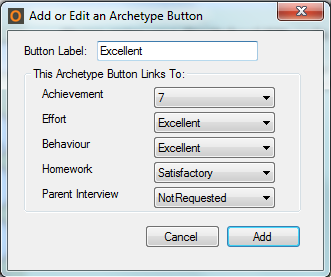
9b) This window will appear. We're going to create generic archetypes, so basically Excellent down to Unsatisfactory. This first Archetype button will be "Excellent" so type that into the Button Label, and select the highest reporting results from each reporting type's drop-down box.
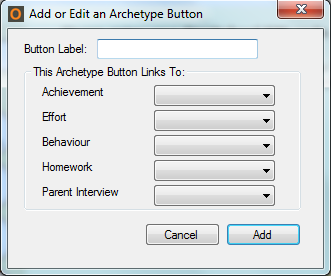
The blank window pops up...

...And choose options from each Reporting Type

9b) Click "Add", an the Archetype button will be added to the Archetype Toolbox. Repeat step 9a to create a small variety of different Archetypes.
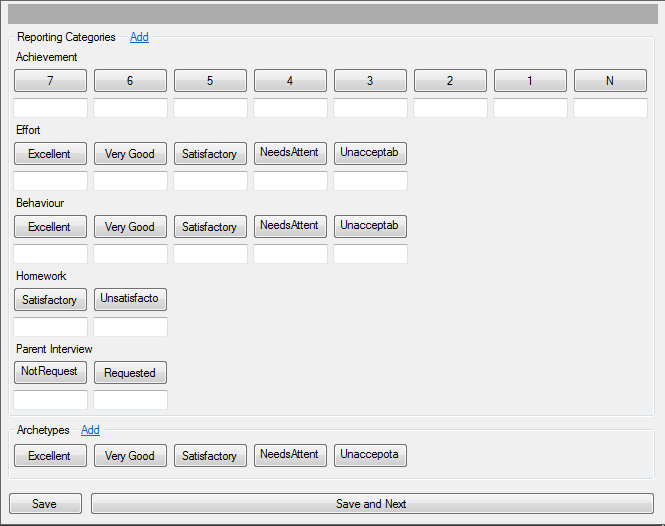
I chose to make 5 generic Archetypes: Excellent, Very Good, Satisfactory, Needs Attention, and Unacceptable
10) At this point you're done. Close the program and it will automatically save its settings in the same directory as the executable as "settings.txt". You can then distribute the executable with the settings file to other teachers at your school and they won't have to go through this setup process. You may want to direct them to this guide to using OneSchool Reporting Helper, though.

Download the program here, or the source code here. Cheers!
Wednesday, March 19, 2014

OneSchool Reporting Helper - Faster Comments for Queensland Teachers

This is a guide to using OneSchool Reporting Helper. To learn about first-time setup, continue to my next post.

At my school, we do our end-of-term reporting through a system called OneSchool. The data entry system is pretty tedious, so I tried to streamline the process. I call the result OneSchool Reporting Helper. What it does is add three sets of extra functions to your data entry system:
  • One-click Reporting Category buttons to assign a grade with a single click rather than through drop-down menus
  • One-click Archetype buttons so that you can generate a report for "typical" students with a single click
  • Auto-comments allow you to add comments to the report based around your reporting choices. 
In practice, it looks like this. We start with a blank Report:

A blank report with the Reporting Hepper side-by-side
And with one click of an Archetype Button, the report is filled according to that type:
A filled report based on the Satisfactory Type. Satisfactory has been configured to be:
Achievement - 5
Effort - Very Good
Behavior - Very Good
Homework -  Satisfactory
Parent Interview - Welcome, but not Requested

Not only are all the reporting fields auto-filled, but the comments that I selected for each reporting value are also auto-filled. This report is now complete. I can press save and next to report on the next student.

If I don't like the comments I've chosen for each reporting category and value I'm free to type into the boxes and change them. I can even add multiple comments by separating them with comments.


If the student is close to an Archetype but not quite, I can click the Archetype, then adjust using the Reporting Category buttons:

Using the Achievement - 6 button I can change this student's achievement from a 5 to a 6 and adjust the comment as well.
Finally, the Archetypes might not suit me and my reporting so they can be adjusted by right-clicking on them:

Right-Click on a button to edit its function.
You can download OneSchool Reporting Helper here. The source code is available here. More in-depth instructions for first configuration are coming soon...

Monday, February 24, 2014

Charge Lab - Charge, Field, and Equipotential Surface Simulation in C#


For the past couple of weeks I've been playing around building a Charge Simulation in C#. The result is Charge Lab, a 2D simulator that can:

  • Simulate motion of charges due to adjacent charges
  • Fill the edges of conducting surfaces
  • Produce Field Lines
  • Measure Potential
  • Draw Equipotential Surfaces
Place charges and observe attraction and repulsion
Charges migrate to the edges of conductors and
congregate in the corners


Observe Field Lines
Observe Equipotential Surfaces and Potential Gradients


Field Strength inside a conductor is zero (nearly)

More conductors and field strengths


I'm putting a version of the program out there now even though it's not finished because it's in a usable state. My students and I have been playing around with it in class and it seems to be really valuable for observing how charges behave on conductors as well as shapes and structures in Electric Fields. But I need some help sorting out some of the remaining issues surrounding charges moving along surfaces. Any comments you have are welcome!

Issue: Charges can't slide across diagonal edges well


See the charge on the left? He's stuck on a corner between two diagonal pixels. His two buddies to the right should be pushing him down the line to the lower left, but he can't get over the edge of the pixel.


Solved Issue: Potential Gradients (and therefore Field Lines as well) were not matching theory quite right.

In order to get charges in this 2 dimensional simulation to distribute themselves around the edge of a conductor like they would in 3 dimensions, I made a modification to Coulomb's Law. Ignoring any units and constants, the two dimensional spherical surface around a charge becomes a one dimensional circumference of a circle. More discussion here.

Transforming Electrostatics Equations from 3 down to 2 Dimensions
(k' is a different constant to k)

I'm not 100% sure about these adjustments. They seem to produce charge and field behavior in 2 dimensions that matches what we expect in 3 dimensions. I'm happy to discuss this issue more if there is interest.

I'm still working on these issues, but feel free to have a stab at them. You can play around with the source files here, or download just the program here.

Monday, February 17, 2014

Superposition, Interference, and Audio Engineering

When musicians record in the studio, the will often record each instrument separately. Each recording would be stored in some sort of loss-less format, an example of which is .wav

A portion of a .wav file shown in Audacity
I'm not sure if the .wav file is a record of pressure over time or velocity over time, but either way it's a record of the sound wave received by the microphone. Each part (vocals, guitar, bass, drums, etc) will have one or more records and the Audio Engineer's job is to use superposition to combine all those parts into one file for the consumer.

For a demonstration of sound and superposition, I found a sample set of these separate recordings for Iron Maiden's "Run to the Hills" and used Audacity to combine them into three different files:

  • The complete song sample with all the parts
  • The song sample with all the parts except for the lead vocals (this is like a karaoke version)
  • An inverted version of the instruments-only song sample.
The normal Instrumental song and the inverted song side-by-side

I can then use Audacity to re-play those files in different combinations. I like to get the students to think about:

  1. Will the inverted instruments only file sound different to the sound wave when it's right-side-up?
  2. What will it sound like when the inverted instrumental track is played with the right-side-up track simultaneously? Audacity can load multiple files and play them all at once so we can test this out
  3. What will happen if I play the complete song and the inverted instrumental simultaneously?
If you'd like to run this demonstration you just need Audacity (or something similar) and the song files, which you can download here:

Thursday, February 13, 2014

Sinusoidal Components of a Square Wave

One of those mind-blowing things you learn studying Engineering is that functions can be expressed as a sum of sinusoids. The math is pretty well beyond most high school math and physics students but I have had some success presenting the idea and observing the phenomenon. I put together a quick simulation in excel that can be used to generate a sequence of higher-and-higher frequency sine waves that add up to a square wave.


You have to copy the entire column D, and paste it repeatedly into adjacent columns. You can keep going through the graphs into columns I, J, K, etc if you want.

Each column is a sine wave. As we move right through the columns, the frequency increase and the amplitude decreases. You can see all the sine waves together on the lower graph.


On the upper graph, we have the sum of all the superimposed waves. The more higher-frequency waves we add, the more square-like the sum becomes.

If you're curious, have a look at the formulas used to calculate the sine waves. You can also read more about the frequency components of sine waves here.

Standing Wave Formation Simulation

The latest version of Java has thrown a huge wrench into my classroom-machine. It won't allow me to run un-signed applets unless I add them to a whitelist. That's all well and good except that the permissions that my school assigned to my account prevent me from making changes to that whitelist. Grrrr.

Anyway, I can no-longer run many of my favorite physics applets in class, including this awesome simulation of a standing wave forming in a string with reflection.

From: Walter Fent
I've been learning a lot about VBA in Excel recently and decided to have a go at re-making the simulation in Excel. The result is a little rough-around the edges but it will work for my purposes:


You must enable macros to use the simulation. You can use the wavelength box to adjust the width of the waves. The sheet is protected, but there's no password so if you want to muck around you can unlock the sheet and play with the VBA code. I'm sure there are improvements to be made.